RESULTS
Major trends in land use change patterns within the study area are outlined in the tables below. Our team also analyzed the data using statistical & spatial modeling techniques. See the peer-reviewed publication in Agriculture, Ecosystems, and Environment for more details.
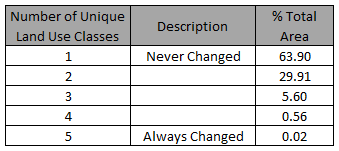
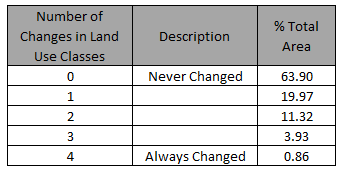
Overview of Entire Study Area
|
|
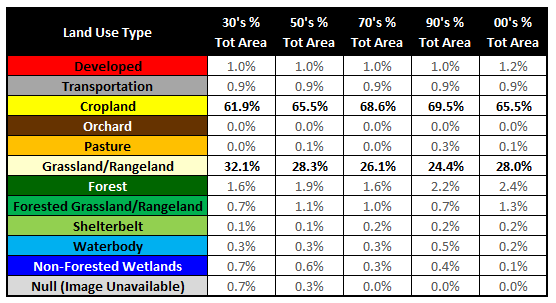
Land Use Change Over Time: 1930s - 2000s
Figure 1. Top Ten Most Common Land Use Change Patterns within the Study Area
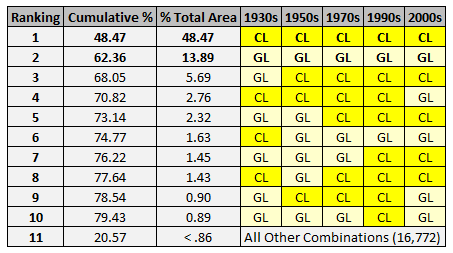
Figure 2. Top Ten Most Common Land Use Change Patterns by State
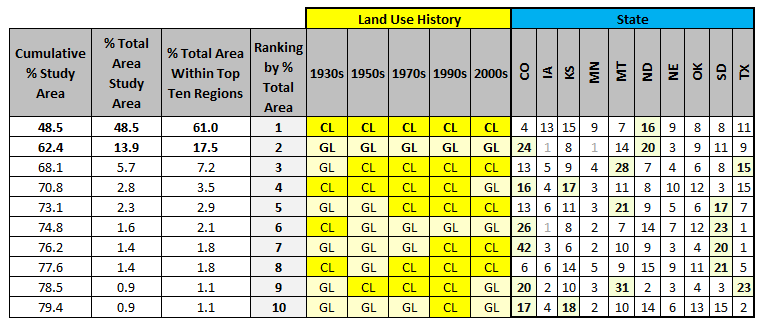
Figure 3. Top Ten Most Common Land Use Change Patterns by Vegetation Zone
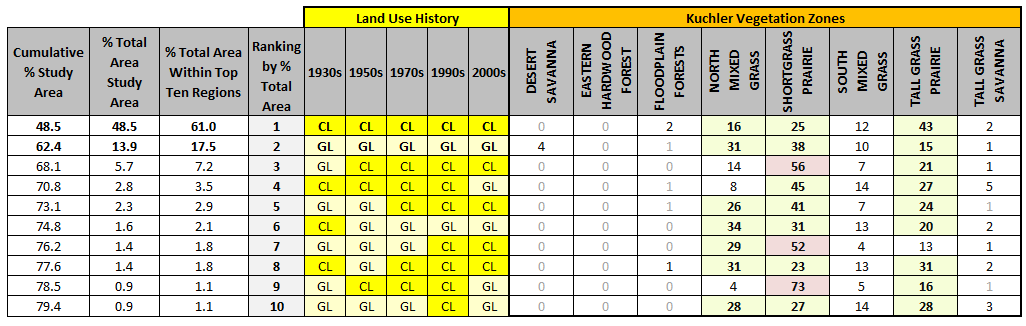
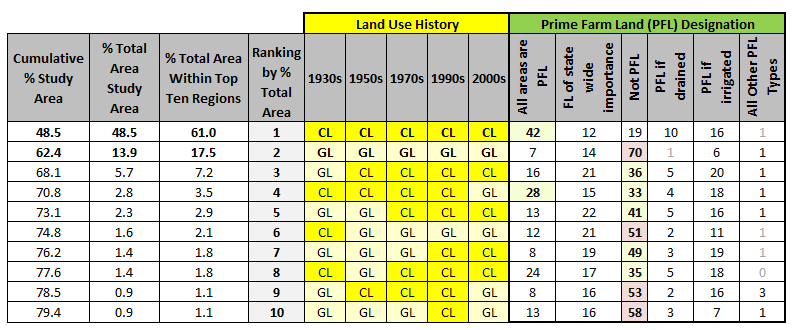
Figure 4. Top Ten Most Common Land Use Change Patterns by Prime Farmland Designation
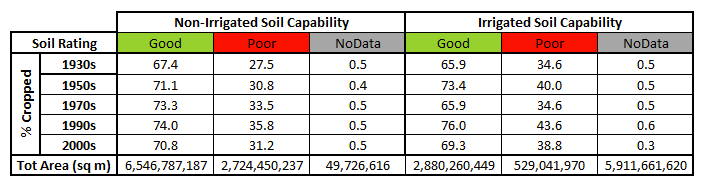
Cropland vs. Soil Capability
Non-Irrigated Soil Capability within Study Area [nirrcpl]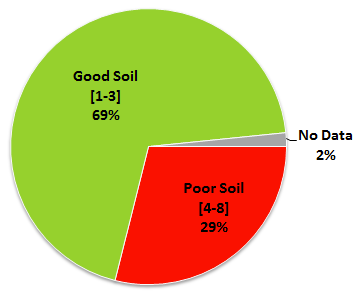
|
Irrigated Soil Capability within Study Area [irrcpl]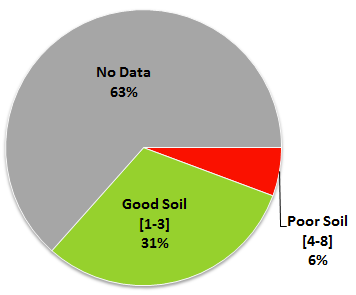
|
Findings
|
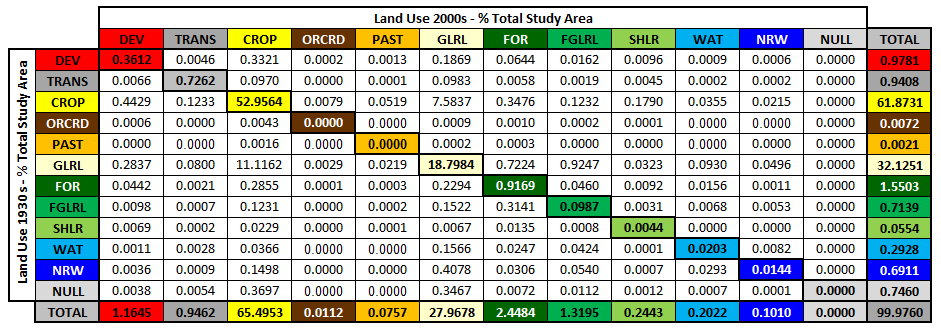
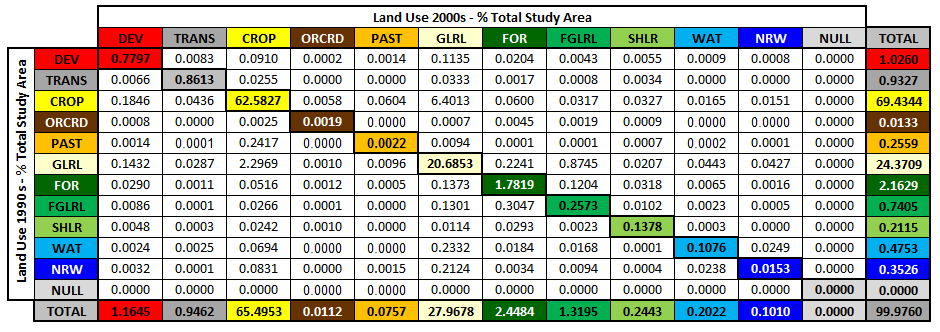
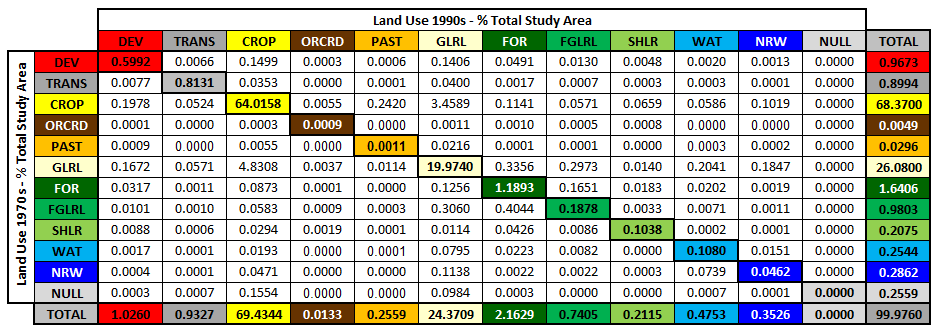
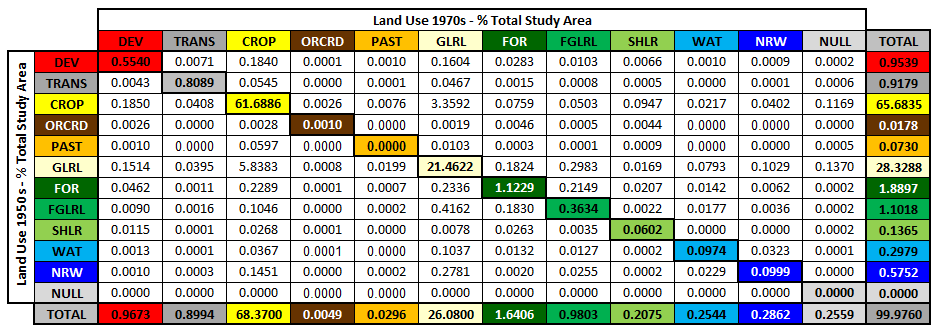
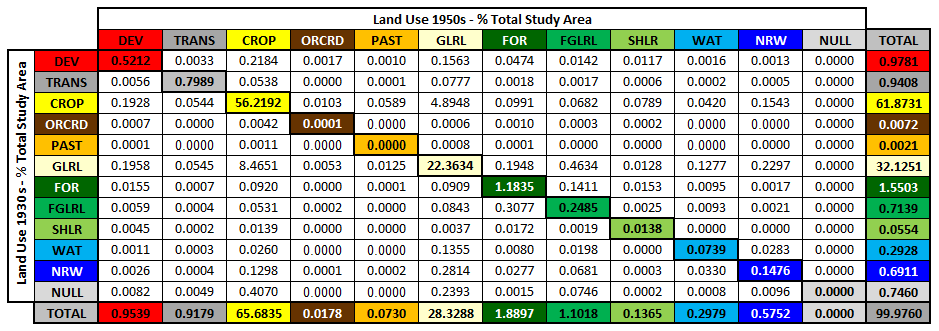
Land Use Change Matrices