DATA OVERVIEW
The final output data falls into four major categories described below:
|
AERIAL PHOTOS
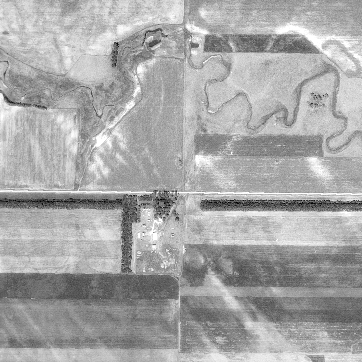
Format: Raster
Years: 1930s, 1950s, 1970s, 1990s, 2000s Description: Aerial photos covering the study area for five time periods. Our team created custom mosaics for the 30s, 50s, and 70s time periods. Mosaics for the 90s and 00s were available from the USDA. |
BOUNDARIES
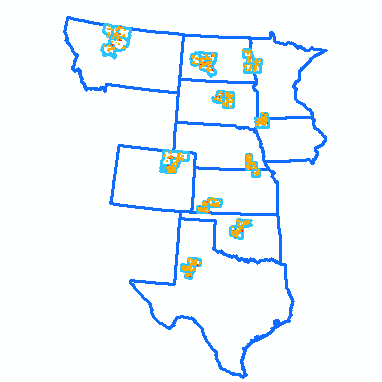
Format: Vector
Description: Study area boundaries. Sample Grids and Boxes are sub-divisions of the Public Land Survey System.
|
LAND USE
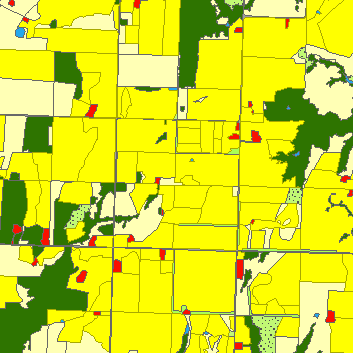
Format: Vector
Years: 1930s, 1950s, 1970s, 1990s, 2000s Description: Polygons representing land use at each time period. The data was created by a team of 18 research assistants who manually interpreted time-series aerial photo mosaics. |
NATURAL FEATURES
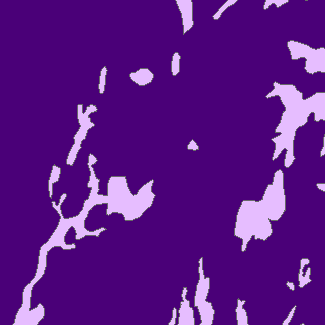
Format: Vector
Description: Ancillary datasets representing soils and vegetation zones zones were downloaded from public websites and then customized for our project.
|